Debugging tips when writing an emulator
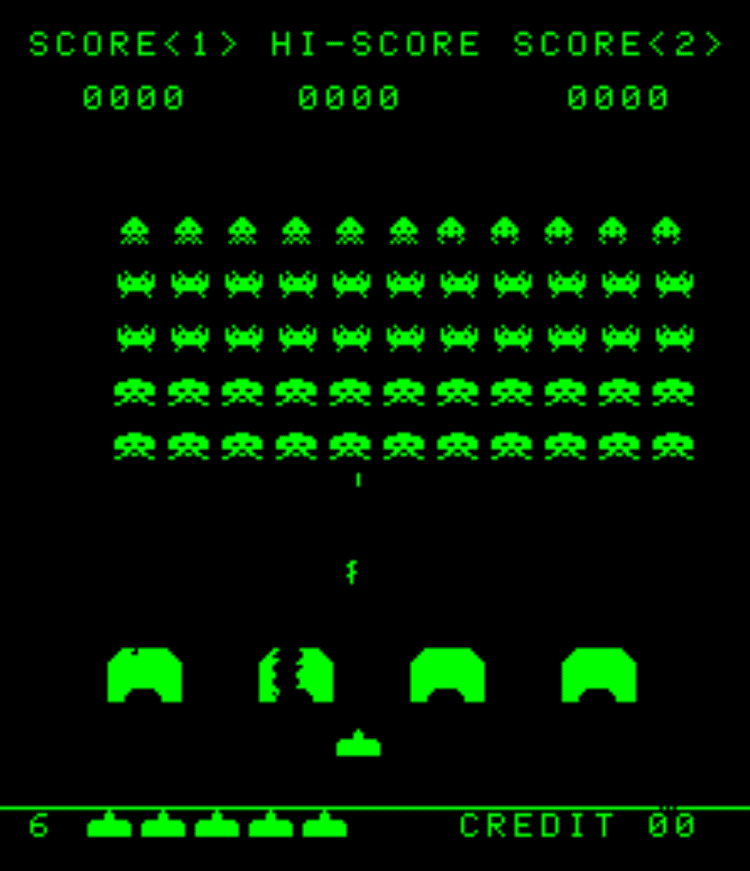
Recently I completed my first ever emulator for the Intel 8080 processor. The emulator successfully runs Taito's 1978 hit Space Invaders. I started the project in 2020 and got it to a state where the title screen would display. I then put the project down and more recently rewrote it in Typescript and utilised pure functions to aid code reuse, reduce bugs and improve testability (Give it a try here).
What is an emulator?
Lets say you took the machine code off of your Pokemon gameboy cartridge dropped it on your laptop and tried to run it, your laptop would never be able to execute that machine code.
The reason why is because your laptops underlying hardware speaks a different language to a Gameboy (if your laptop can run gameboy games without emulation I suggest you're due for an upgrade 😅)
An emulator is essentially a piece of software that pretends to be a set of hardware (e.g a space invaders arcade machine) that can read and translate machine code that isn't natively supported on the running hardware.
For example lets take a look at the machine code in space invaders that increases the number of credits when someone inserts a coin.
3A EB 20     // LD A
C6 01        // ADD
32 EB 20     // STA A
Each line represents an instruction to the CPU. The first byte represents the type of instruction. The second and third bytes represent arguments passed into the instruction.
3A (LD A) is for loading a byte into the Accumulator register. The accumulator register is used to perform calculations. The second and third bytes in this case
represent a 16 bit memory address (0x20EB). In Space Invaders 0x20EB is where the current credits are stored in RAM.
C6 (ADD) is the add instruction. Here we add the second byte to the accumulator register and therefore are incrementing the total credits by 1.
32 (STA A) is then to write the contents of the accumulator back into memory. Here the 2nd and 3rd arguments represent the memory address we're writing to.
As you can see again 0x20EB. So we've bumped the credit count and are storing the result back into memory.
Ok, so how can we make our computers understand this? Here's a very rough example in Javascript on how we could translate this credit bump sequence into something the browser could understand.
  // Declare an array that acts as our RAM.
  // The array contains all
  // space invaders machine code.
  // Each element represents 1 byte.
  const memory = [0x3A, 0xEB, 0x20...];

  const registers = {
        "acc": 0,
        // program_counter
        "pc": 0
  }

  const add = (register) => {
        registers.acc += memory[register.pc + 1];
        return { size: 2 };
  }

  const build_addr = (register) => {
        const lsb = memory[register.pc + 1];
        const hsb = memory[register.pc + 2];

        return hsb << 8 | lsb;
  }

  const read_to_accumulator = (register) => {
        const addr = build_addr(register);
        register.acc = memory[addr];

        return { size: 3 };
  }

  const write_from_accumulator = (register) => {
        const addr = build_addr(register);
        memory[addr] = register.acc;

        return { size: 3 };
  }

  const ops = {
        0x32: write_from_accumulator,
        0x3A: read_to_accumulator,
        0xC6: add,
  }

  while(!stopped) {
        const instruction = ops[memory[register.pc]];
        const result = instruction(register);
        register.pc += result.size;
  }
The program counter (pc) is used to keep track of where in the code we are currently executing. After executing we increment the pc so that it skips over the previous instructions arguments and points to the next instruction.
Thats great.. But how would you get space invaders to display on screen?
Our space invaders machine code will be dropping into RAM a series of bytes that can be used to interpret the display.
All we then have to do is make a HTML Canvas element, iterate over said memory in RAM and draw out the pixels!
function render() {
    if(!context) return;

    context.imageSmoothingEnabled= false;
    context.fillStyle = "rgba(0, 0, 0, 1)";
    // Clear screen
    context.fillRect(0,0, 224, 260);
    // address of the start of v_ram
    let address = 0x2400;
    // print to screen, column by column
    for(var k = 0; k < 224; k++) {
        for(var l = 256; l > 0; l= l - 8) {
            const graphicsByte = memory[address];
            for(var m = 0; m < 8; m++) {
                var theBit = graphicsByte & 1;
                graphicsByte = graphicsByte >> 1;
                // Each byte represents 8 pixels
                // If the bits enabled, the pixel
                // is filled.
                if(theBit & 1) {
                    context.fillStyle = "rgba(0, 256, 0, 1)";
                    context.fillRect(k,l - m, 1, 1 );
                }
            }
            // increment address to get next byte from v_ram
            address++;
        }
    }
}
Tips for debugging emulators
Debugging your emulator will be a challenge and you'll spend a lot of time stepping through machine code line for line.
Conditional breakpoints
Conditional break points are a godsend. Especially when you're trying to debug a problem that only occurs at a very specific step within the program you're emulating.
Conditional break points can be achieved by simply wrapping a debugger statement within an if statement for the condition
you're wanting to check
while(!stopped) {
    const pc = register.pc;
    if(pc == 0xbb) {
        debugger;
    }
    const instruction = ops[memory[register.pc]];
    const result = instruction(register);
    register.pc += result.size;
}
You can also set a conditional breakpoint using your browser dev tools.
Logging when a new operation is performed
Once I got the screen rendering I found another way to track down broken instructions. I'd create a Set of opcodes the program had seen before. If it hadn't seen the opcode before, print it out and add it to the set.
That way when the screen starts to glitch out and break, you have a collection of suspicious operations you can start investigating.
I'd say this technique helped me resolve the majority of the bugs I encountered.
const opSet = new Set();

while(!stopped) {
    const instructionCode = memory[register.pc];
    if(!opSet.has(instructionCode)) {
        opSet.add(instructionCode);
        console.log(`Executed ${instructionCode}`);
    }
    const instruction = ops[instructionCode];
    const result = instruction(register);
    register.pc += result.size;
}
Logging when a new section of the game has been encountered
This is very specific to Space invaders. There are some fantastic resources that can be used to help understand the underlying machine code. One of which is by computer archeology. who have written a full breakdown of the Space Invaders machine code line for line. This is super useful as you can start getting an understanding of when certain procedures in the code are being executed.
Using the article by computer archeology, I created a map of addresses to procedures which I could then print when encountered to get a better understanding of what the game was trying to do. It was quite useful for detecting infinite loops.
const debugProcs = {
    0x0000: "Reset",
    0x0008: "ScanLine96",
    0x0010: "ScanLine224",
    0x00B1: "InitRack",
    0x0100: "DrawAlien",
    0x0141: "CursorNextAlien",
    0x017A: "GetAlienCoords",
    0x01A1: "MoveRefAlien",
    0x01C0: "InitAliens",
    0x01CD: "ReturnTwo",
    0x01CF: "DrawBottomLine",
    0x01D9: "AddDelta",
    0x01E4: "CopyRAMMirror",
    0x01EF: "DrawShieldPl1",
    ...
};

while(!stopped) {

    if(debugProcs[register.pc]) {
        console.log(`Entered ${debugProcs[register.pc]}`);
    }
    const instruction = ops[memory[register.pc]];
    const result = instruction(register);
    register.pc += result.size;
}
Summary
Writing an emulator is a great challenge and I'd recommend everyone to try it out. They are very difficult to debug, but hopefully some of the tips I've written up in this article may help out. There are also some amazing resources online which I've listed below!